


Plant Hardiness Zones
About Those USDA Climate Zones
The familiar United States Department of Agriculture Plant Hardiness Zone Map is based on the average annual minimum temperature for each zone. Needless to say, some years a zone will get a minimum temperature lower or higher than the average. Nevertheless, the average minimum temperature is a fairly good indicator for which plants can be grown in a given zone. Before the USDA Plant Hardiness zone maps were created, most farmers knew what could be grown in their area based on local customs and their own trial and error.
 The latest version of the USDA Plant Hardiness Zone Map was released in 2012. It divides the United States (including Hawaii and Puerto Rico) into 26 zones: 13 zones, each with an a or b sub zone.
USDA map: http://planthardiness.ars.usda.gov/PHZMWeb/
The hardiness zone map does not tell us anything about annual high temperatures. (Try growing rhubarb or cranberries in Miami.) The American Horticultural Society has developed a heat zone map that is based on the average number of days each year that a region experiences a high temperatures over 86°F (30°C), the temperature at which many plants begin to suffer physiological damage from heat.
heat zone map: http://ahsgardening.org/gardening-resources/gardening-maps/heat-zone-mapwebsite.
 With the USDA’s Plant Hardiness Zone Map and the AHS’s Plant Heat Zone Map, the gardener should be able to accurately identify which plants can tolerate the average temperatures in a particular region. However, there are other factors we must consider.
Fine scale climate variations can result from smaller areas within a zone being more sheltered or more exposed than the average for the zone. Blacktop or concrete nearby can create a micro-climate that is warmer than the surrounding region, and low spots can do the opposite. A sheltered area in front of a south-facing wall will be warmer on the coldest nights, whereas a valley or low spot in the yard will be cooler (because cold air sinks).
 Other factors, not taken into account by the climate zone maps can come into play as well. Plants start to acquire cold hardiness in the fall when temperatures begin to drop and days begin to get shorter. A sudden cold snap early in the season can be deadly to plants that can tolerate even colder temperatures in the middle of winter. Plants begin to lose their acclimation to cold in early spring as days become longer and temperatures begin to rise. A sudden freeze after plants have come out of dormancy can be lethal. Some plants can survive a short period of extreme cold, but are killed by longer durations of the same temperature
The zone maps tell us nothing about local humidity and rainfall, which can be limiting for many kinds of plants. Plants adapted to climates with high annual rainfall may not be able to survive in areas with desert-like condition, even if the areas are in the same temperature zones. You can’t grow rice in Arizona (without irrigation).
The hardiness zone maps will never take the place of the knowledge and experience that gardeners accumulate about their own gardens, but they provide a good starting point.
A list of best selling plants per zone that Perfect Plants Carries:
Zones 5-10

Zones 7-11

Zones 3-9

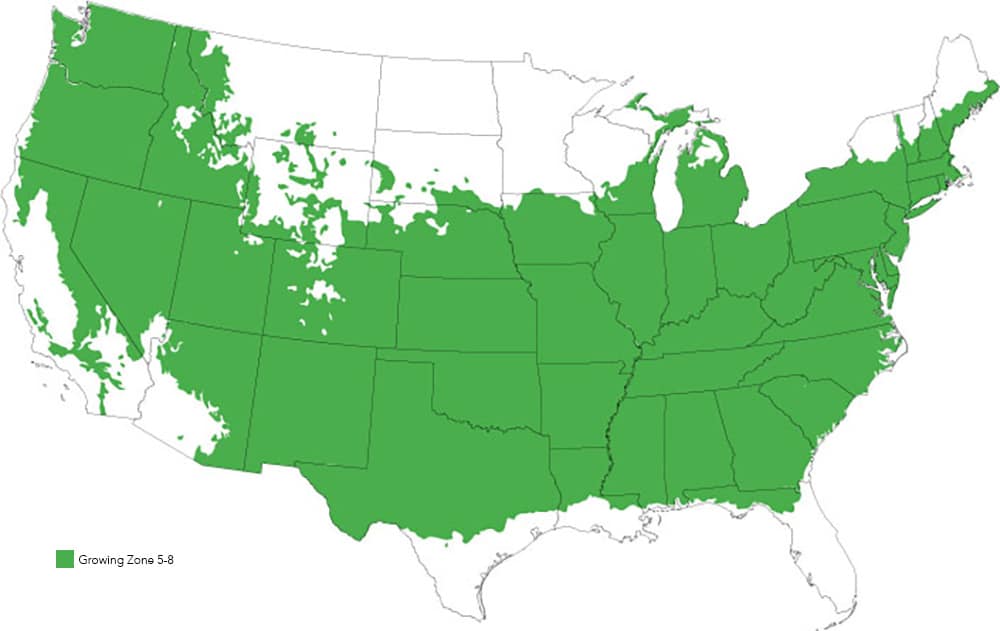
Zones 5-8
Zones 5-9

Check out our other blog post on plant hardiness zones.